机器学习-NBA赛季比赛预测
本项目展示了如何对nba官方网站的数据进行处理,并根据历史数据对新赛季的比赛进行预测的过程。
数据集数据来源:NBA 官方网站,数据集来源:NBA_scrapped_data。文件包含从1949到2019的NBA每场比赛的数据。
本介绍以视频的方式,向大家展示一个机器学习分类分析实例,包括数据采集、数据处理和数据分析这几个步骤:
- URL文件导入本项目Demo数据集
- 通过机器学习JupyterLab步骤进行数据处理并导出到Hive
- 通过机器学习JupyterLab步骤进行分类模型训练以及评估
- 通过机器学习JupyterLab步骤进行LR模型调参
完整步骤内容文档下载
步骤一:新建个人/机构项目
用户点击界面上创建新项目,填写名称可参照下图、


步骤二:添加项目步骤
从当前项目步骤中进行添加,点击各个目录中的具体操作,依照该方法,分别添加以下几个步骤:
1.数据采集–URL文件导入
2.数据分析–jupyterNotebook
添加完成后,对步骤进行修改名称,以区分,可以参照下图进行修改。

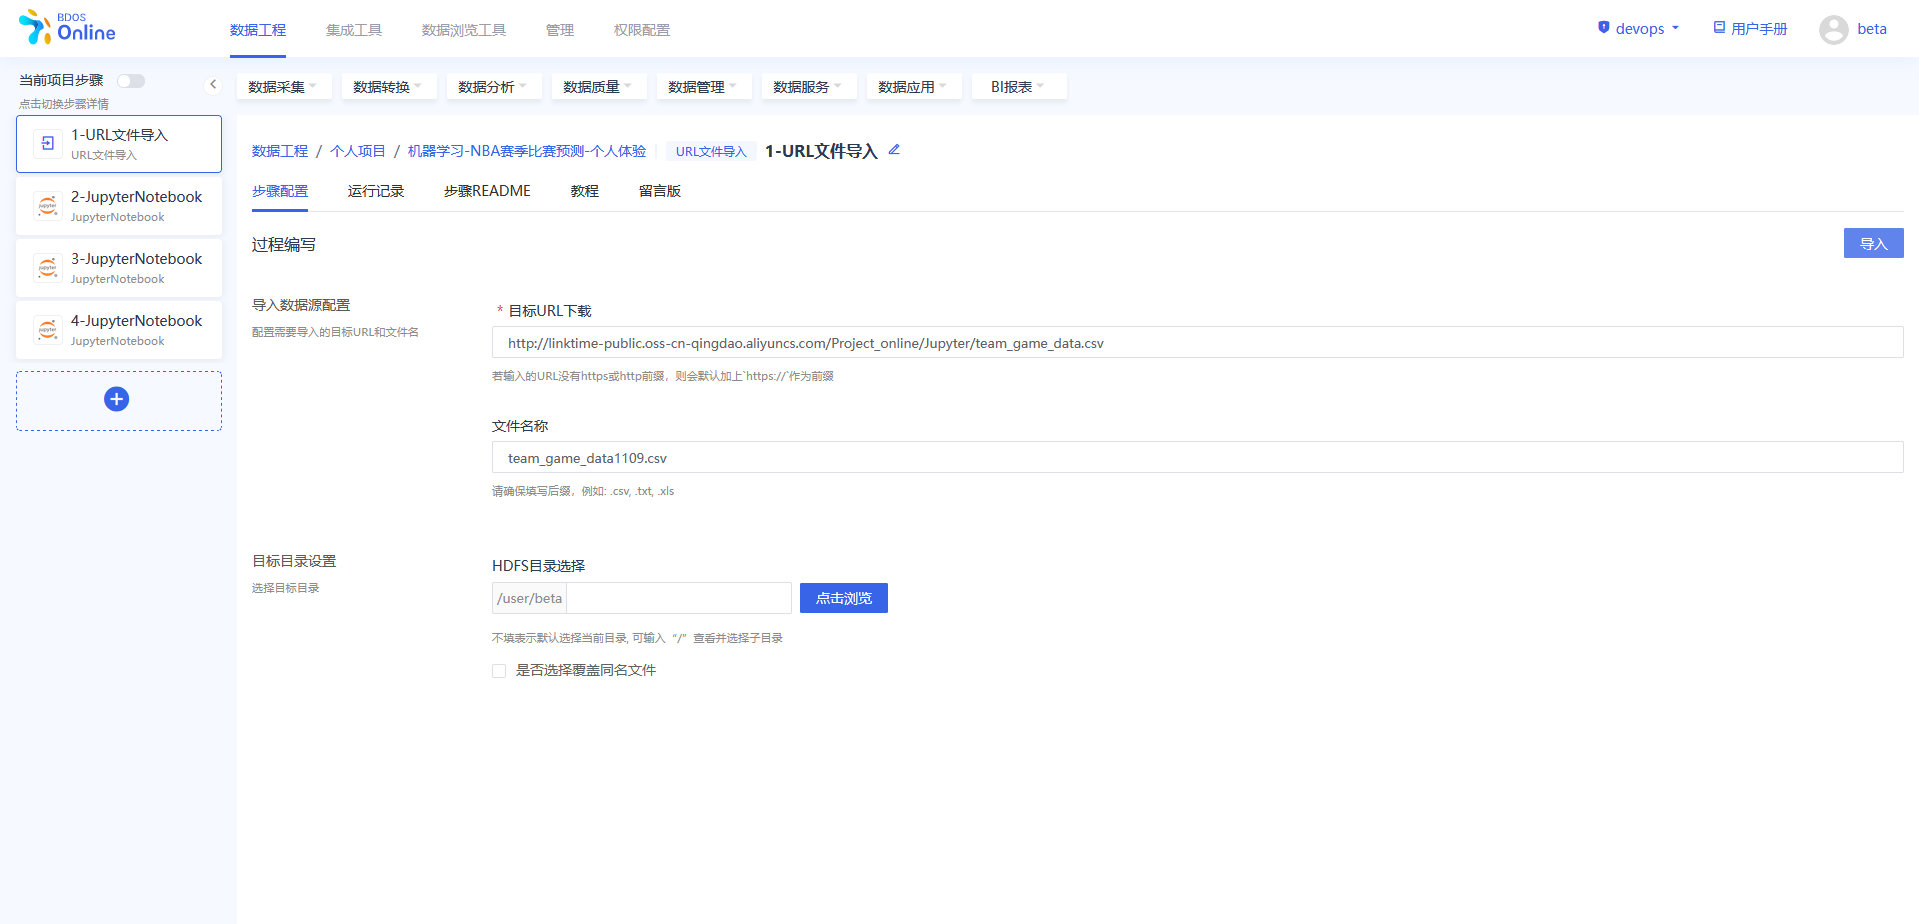
步骤三:URL文件导入
在BDOS Online大数据平台,用户可通过URL文件导入,导入到系统的HDFS。
NBA赛季比赛名称数据集Web下载路径: http://linktime-public.oss-cn-qingdao.aliyuncs.com/Project_online/Jupyter/all_game_scores.csv
NBA球队信息数据集Web下载路径: http://linktime-public.oss-cn-qingdao.aliyuncs.com/Project_online/Jupyter/team_game_data.csv
文件名称: 第一个url对应:nba_demo_1.csv(用户参照示例进行名称自定义并带上文件后缀) 第二个url对应:nba_demo_2.csv(用户参照示例进行名称自定义并带上文件后缀)
HDFS目录选择:保持默认
具体可参照下图,将两个文件导入。
步骤四:数据处理与导出
进入 JupyterLab,在Pysaprk程序步骤对NBA Demo数据进行处理并导出。
步骤一操作
注:
机构项(xxx/xxx为org/xxx)1.替换org/xxx的xxx为机构名称个人项(xxx/xxx为user/xxx)1.替换user/xxx的xxx为当前登录用户名
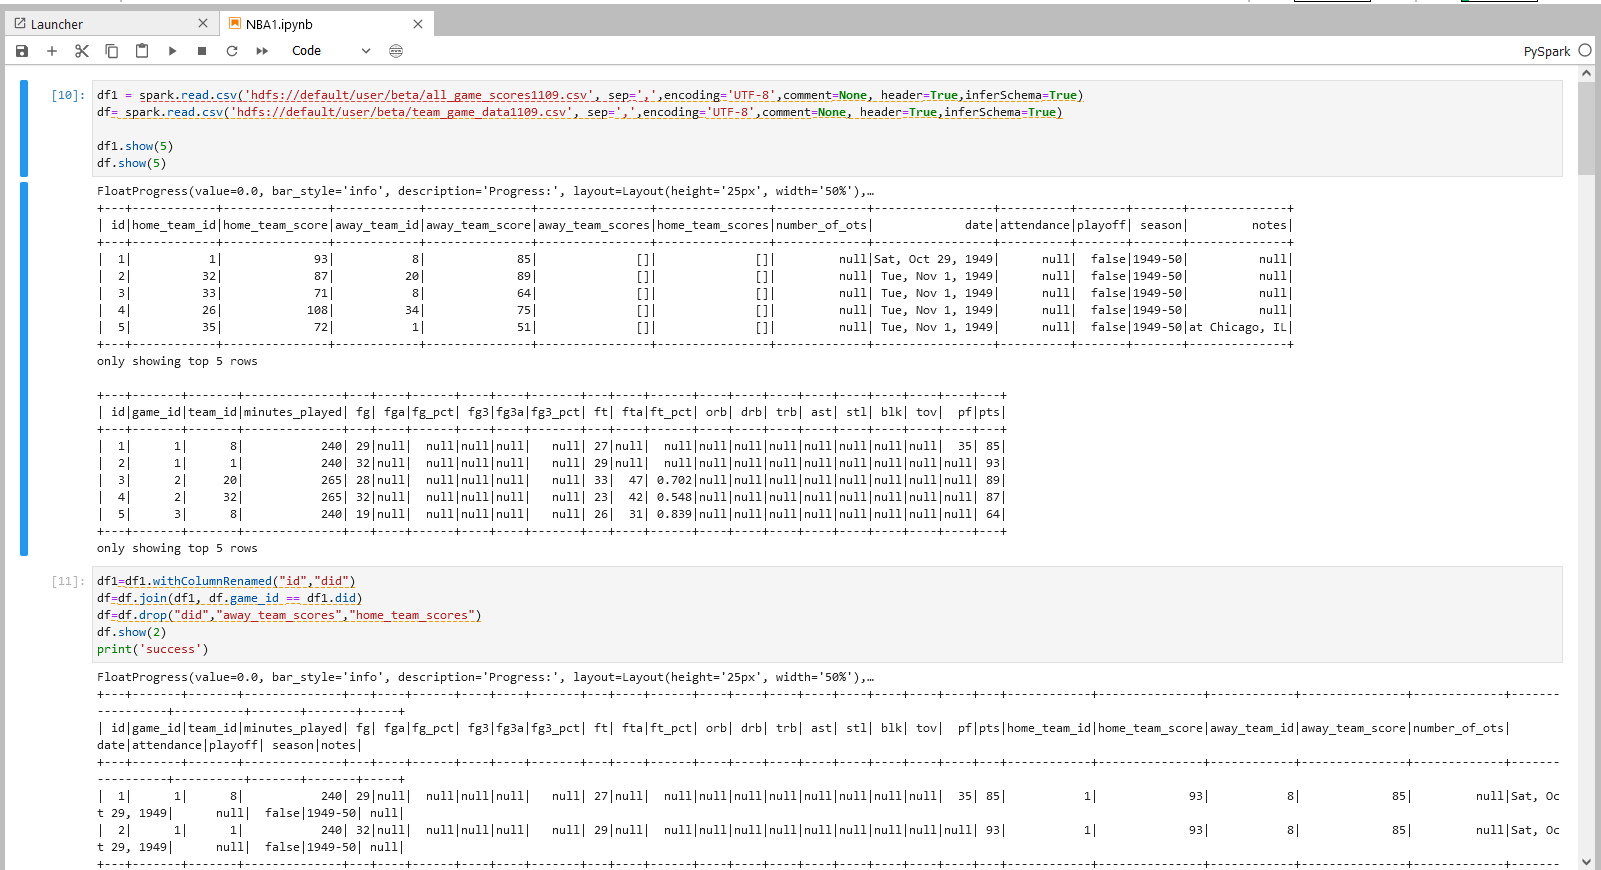
df1 = spark.read.csv('hdfs://default/user/beta/all_game_scores1109.csv', sep=',',encoding='UTF-8',comment=None, header=True,inferSchema=True)
df= spark.read.csv('hdfs://default/user/beta/team_game_data1109.csv', sep=',',encoding='UTF-8',comment=None, header=True,inferSchema=True)
df1.show(5)
df.show(5)
步骤一说明 1.以PySpark的格式读取导入到HDFS的实验数据到PySpark dataframe
2.使用function data.show() 将dataframe 的内容进行展示。如:通过在show()中填写数字,选择需要展示的行数,show(1),即展示数据集第1行,不填则默认展示前20行。
步骤二操作
df1=df1.withColumnRenamed("id","did")
df=df.join(df1, df.game_id == df1.did)
df=df.drop("did","away_team_scores","home_team_scores")
df.show(2)
print('success')
步骤二说明
读入并组合两个csv表格
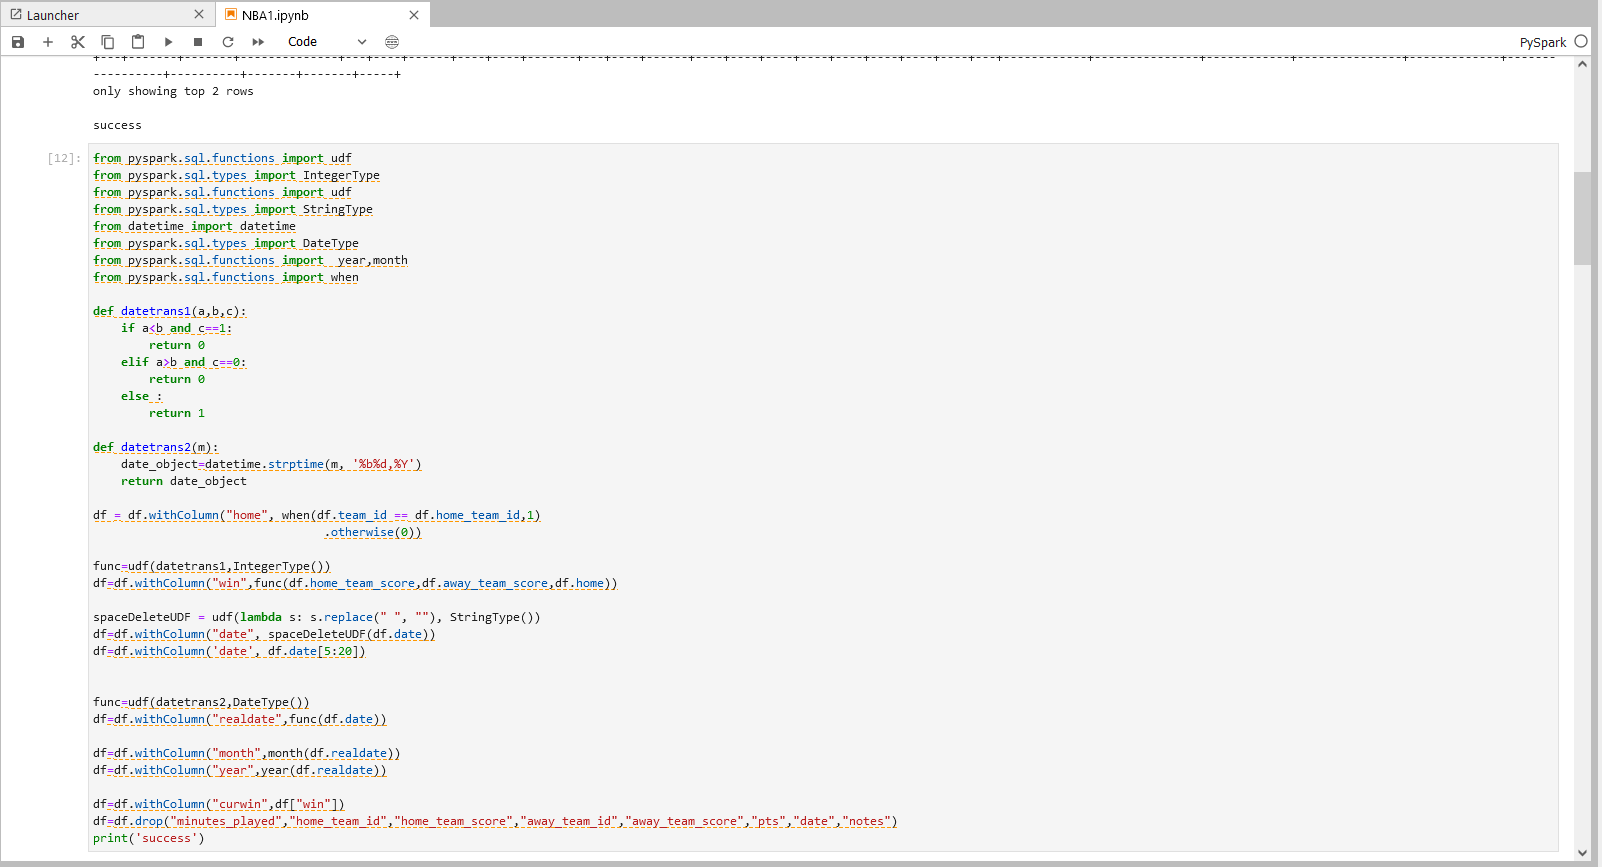
步骤三操作
from pyspark.sql.functions import udf
from pyspark.sql.types import IntegerType
from pyspark.sql.functions import udf
from pyspark.sql.types import StringType
from datetime import datetime
from pyspark.sql.types import DateType
from pyspark.sql.functions import year,month
from pyspark.sql.functions import when
def datetrans1(a,b,c):
if a<b and c==1:
return 0
elif a>b and c==0:
return 0
else :
return 1
def datetrans2(m):
date_object=datetime.strptime(m, '%b%d,%Y')
return date_object
df = df.withColumn("home", when(df.team_id == df.home_team_id,1)
.otherwise(0))
func=udf(datetrans1,IntegerType())
df=df.withColumn("win",func(df.home_team_score,df.away_team_score,df.home))
spaceDeleteUDF = udf(lambda s: s.replace(" ", ""), StringType())
df=df.withColumn("date", spaceDeleteUDF(df.date))
df=df.withColumn('date', df.date[5:20])
func=udf(datetrans2,DateType())
df=df.withColumn("realdate",func(df.date))
df=df.withColumn("month",month(df.realdate))
df=df.withColumn("year",year(df.realdate))
df=df.withColumn("curwin",df["win"])
df=df.drop("minutes_played","home_team_id","home_team_score","away_team_id","away_team_score","pts","date","notes")
print('success')
步骤三说明
补充特殊特征列
1.每队的每场比赛的输赢情况,如果比赛胜利,则该队的特殊特征win为1,反之为0
2.将string形式的日期调整格式并转化为datetime形式
3.从datetime格式中提取月份,年份
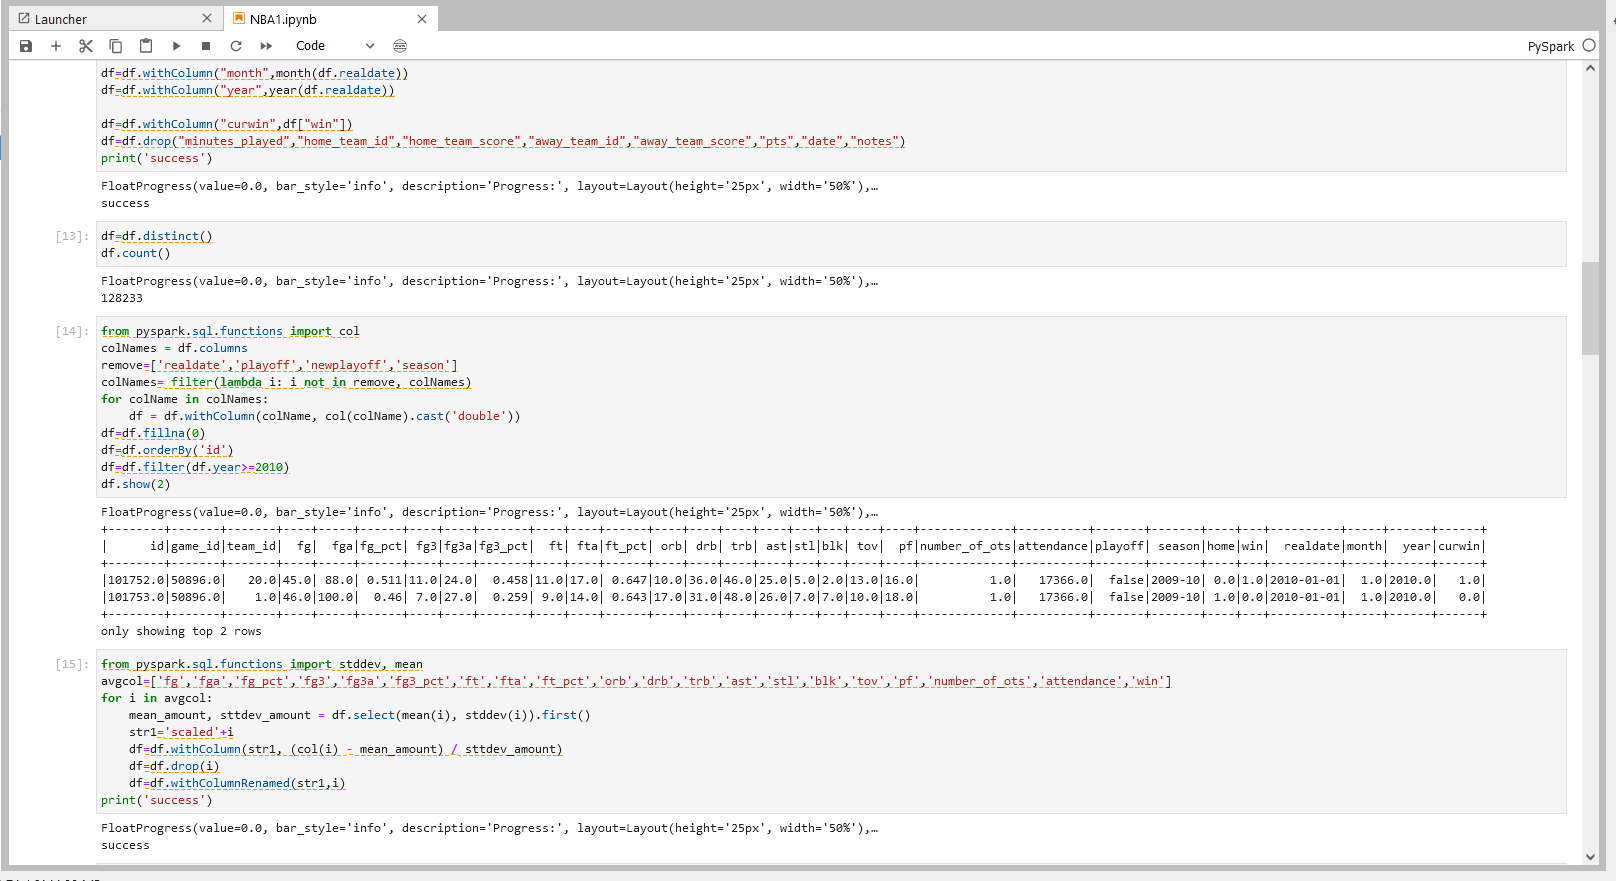
步骤四操作
df=df.distinct()
df.count()
步骤四说明
清洗重复数据
1.整行去重:df.distinct()方程对完全相同的行进行去重
2.dataframe.count()方程打印出列表的行数
步骤五操作
from pyspark.sql.functions import col
colNames = df.columns
remove=['realdate','playoff','newplayoff','season']
colNames= filter(lambda i: i not in remove, colNames)
for colName in colNames:
    df = df.withColumn(colName, col(colName).cast('double'))
df=df.fillna(0)
df=df.orderBy('id')
df=df.filter(df.year>=2010)
df.show(2)
步骤五说明
1.对数据类型进行转换,将string类型数据转换成double类型数据。
2.保留年份在2010后的比赛信息的dataframe
步骤六操作
from pyspark.sql.functions import stddev, mean
avgcol=['fg','fga','fg_pct','fg3','fg3a','fg3_pct','ft','fta','ft_pct','orb','drb','trb','ast','stl','blk','tov','pf','number_of_ots','attendance','win']
for i in avgcol:
    mean_amount, sttdev_amount = df.select(mean(i), stddev(i)).first()
    str1='scaled'+i
    df=df.withColumn(str1, (col(i) - mean_amount) / sttdev_amount)
    df=df.drop(i)
    df=df.withColumnRenamed(str1,i)
print('success')
步骤六说明
计算某列数据的平均值和方差,根据平均值和方差将该列数据进行标准化,即把该列数据的值减去平均值后再除以方差。
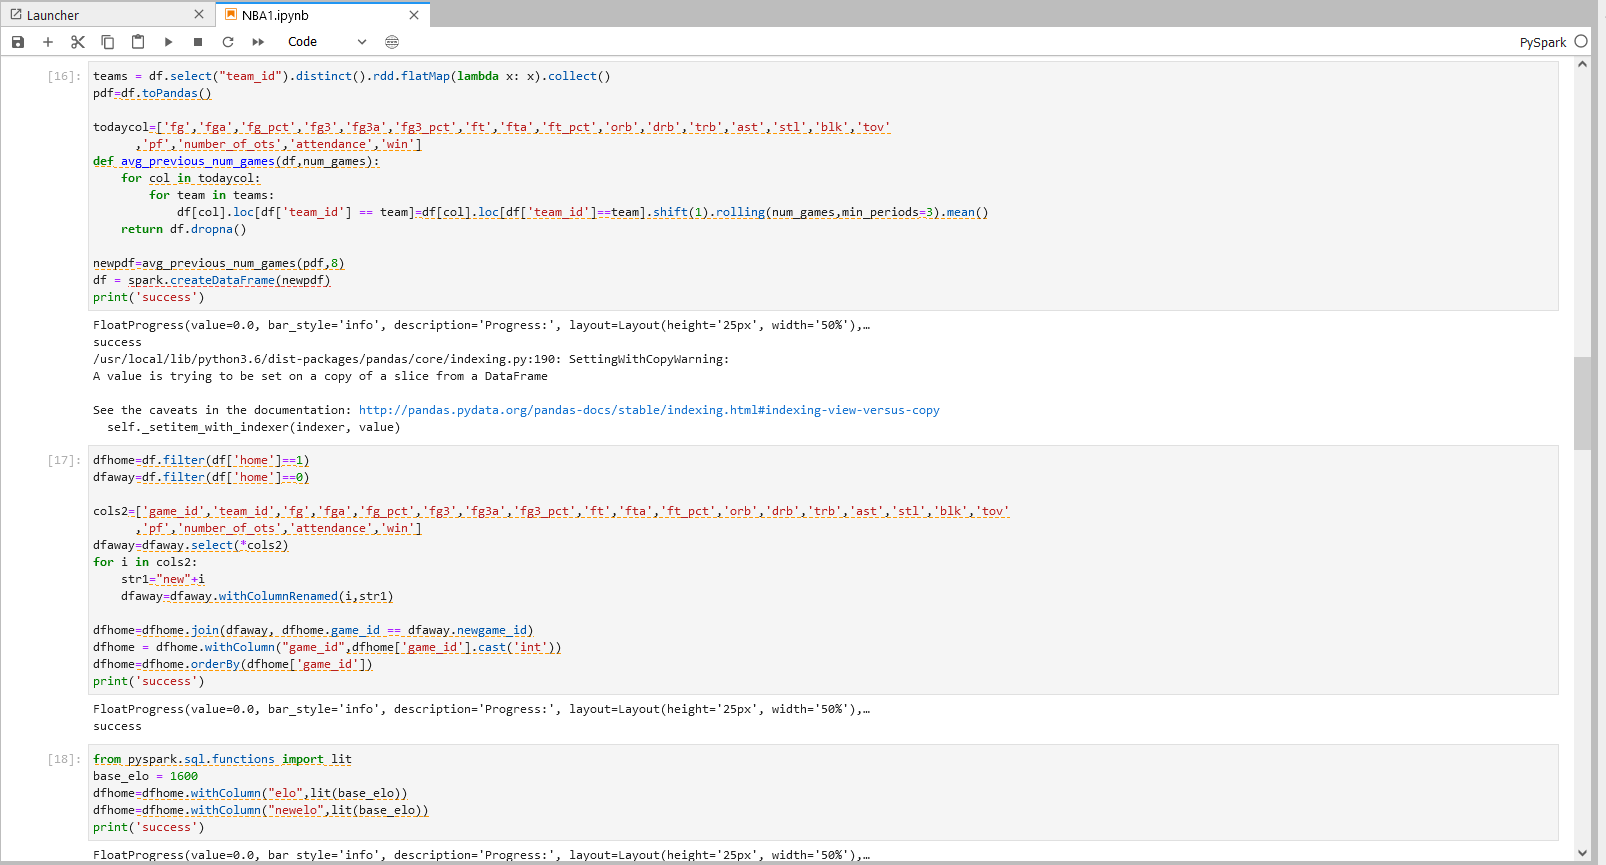
步骤七操作
teams = df.select("team_id").distinct().rdd.flatMap(lambda x: x).collect()
pdf=df.toPandas()
todaycol=['fg','fga','fg_pct','fg3','fg3a','fg3_pct','ft','fta','ft_pct','orb','drb','trb','ast','stl','blk','tov'
,'pf','number_of_ots','attendance','win']
def avg_previous_num_games(df,num_games):
for col in todaycol:
for team in teams:
df[col].loc[df['team_id'] == team]=df[col].loc[df['team_id']==team].shift(1).rolling(num_games,min_periods=3).mean()
return df.dropna()
newpdf=avg_previous_num_games(pdf,8)
df = spark.createDataFrame(newpdf)
print('success')
步骤七说明
将每队每场实时的表现明细数据替换成最近八场比赛的平均数据
1.为了对比赛进行精准推测,通过function avg_previous_num_games对该队的该场比赛表现进行推测
步骤八操作
dfhome=df.filter(df['home']==1)
dfaway=df.filter(df['home']==0)
cols2=['game_id','team_id','fg','fga','fg_pct','fg3','fg3a','fg3_pct','ft','fta','ft_pct','orb','drb','trb','ast','stl','blk','tov'
,'pf','number_of_ots','attendance','win']
dfaway=dfaway.select(*cols2)
for i in cols2:
str1="new"+i
dfaway=dfaway.withColumnRenamed(i,str1)
dfhome=dfhome.join(dfaway, dfhome.game_id == dfaway.newgame_id)
dfhome = dfhome.withColumn("game_id",dfhome['game_id'].cast('int'))
dfhome=dfhome.orderBy(dfhome['game_id'])
print('success')
步骤八说明
将同属于一场比赛的两队信息进行组合
将dataframe分成主场球队比赛数据dataframe和客场球队比赛数据dataframe,将两个dataframe基于打同一场比赛的信息合并,得到的最终dataframe每行数据为一场比赛的主场球队数据与客场球队数据,便于横向比较两个球队的实力区别,更准确地预测比赛输赢
步骤九操作
from pyspark.sql.functions import lit
base_elo = 1600
dfhome=dfhome.withColumn("elo",lit(base_elo))
dfhome=dfhome.withColumn("newelo",lit(base_elo))
print('success')
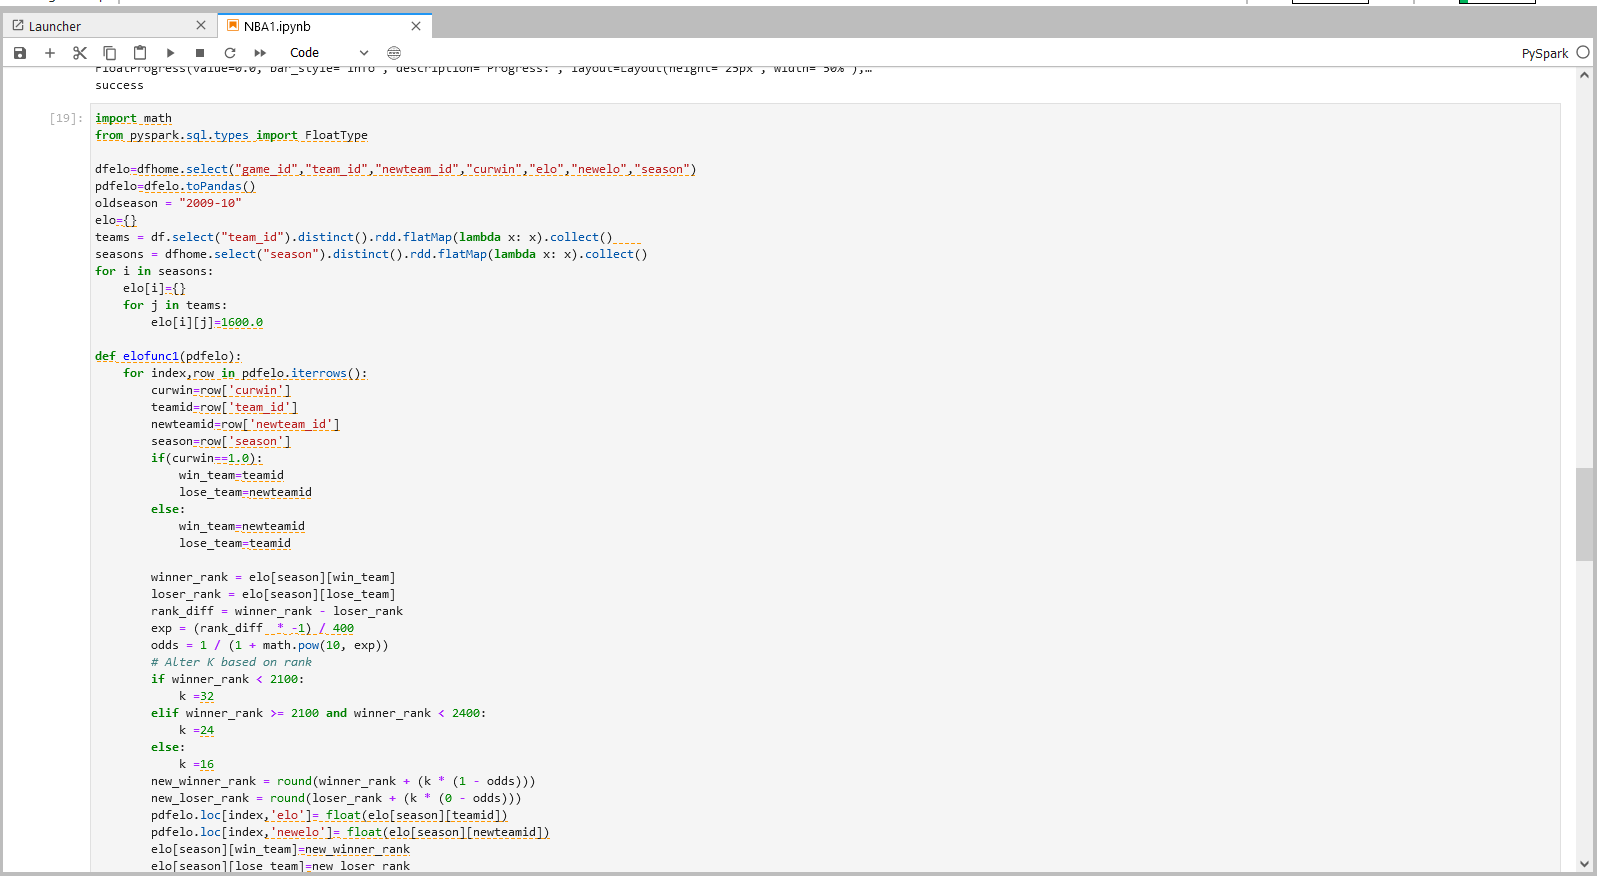
import math
from pyspark.sql.types import FloatType
dfelo=dfhome.select("game_id","team_id","newteam_id","curwin","elo","newelo","season")
pdfelo=dfelo.toPandas()
oldseason = "2009-10"
elo={}
teams = df.select("team_id").distinct().rdd.flatMap(lambda x: x).collect()
seasons = dfhome.select("season").distinct().rdd.flatMap(lambda x: x).collect()
for i in seasons:
elo[i]={}
for j in teams:
elo[i][j]=1600.0
def elofunc1(pdfelo):
for index,row in pdfelo.iterrows():
curwin=row['curwin']
teamid=row['team_id']
newteamid=row['newteam_id']
season=row['season']
if(curwin==1.0):
win_team=teamid
lose_team=newteamid
else:
win_team=newteamid
lose_team=teamid
winner_rank = elo[season][win_team]
loser_rank = elo[season][lose_team]
rank_diff = winner_rank - loser_rank
exp = (rank_diff * -1) / 400
odds = 1 / (1 + math.pow(10, exp))
# Alter K based on rank
if winner_rank < 2100:
k =32
elif winner_rank >= 2100 and winner_rank < 2400:
k =24
else:
k =16
new_winner_rank = round(winner_rank + (k * (1 - odds)))
new_loser_rank = round(loser_rank + (k * (0 - odds)))
pdfelo.loc[index,'elo']= float(elo[season][teamid])
pdfelo.loc[index,'newelo']= float(elo[season][newteamid])
elo[season][win_team]=new_winner_rank
elo[season][lose_team]=new_loser_rank
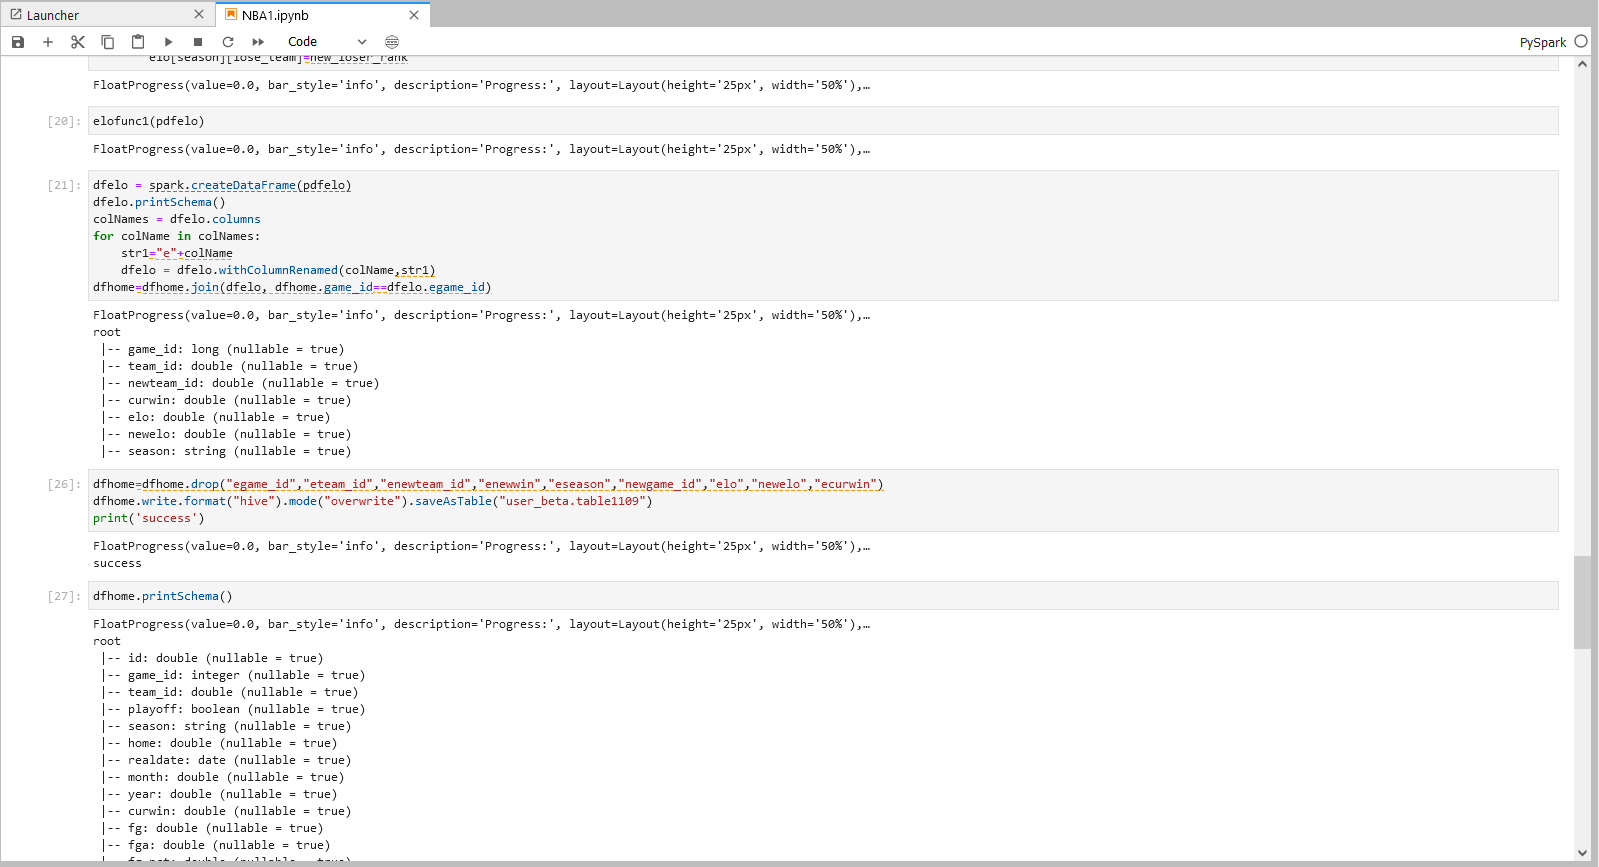
elofunc1(pdfelo)
dfelo = spark.createDataFrame(pdfelo)
dfelo.printSchema()
colNames = dfelo.columns
for colName in colNames:
str1="e"+colName
dfelo = dfelo.withColumnRenamed(colName,str1)
dfhome=dfhome.join(dfelo, dfhome.game_id==dfelo.egame_id)
步骤九说明
根据每场比赛的输赢情况,以1600为起始elo参数,随着比赛输赢情况,让elo实时更新。 因使用特征参数来预测比赛结果,若将每行比赛的输赢情况及时反馈到elo特征系数上,则会使比赛结果影响特征向量,而在预测结果时,假定的情况是比赛结果未知,并特征向量不被当场比赛结果影响,只被之前的比赛结果影响。 因此每场比赛的team_rank先存于dict elo中,在打下场比赛时,dict中的实时更新的elo值赋予到dataframe的该行中,再根据比赛情况计算出新的team_rank,并在dict中更新参与比赛队伍的team_rank。
步骤十操作
注:
机构项(xxx_xxx为org_xxx)1.替换org_xxx的xxx为机构名称 2.替换table为实际Hive目标表名
个人项(xxx_xxx为user_xxx)1.替换user_xxx的xxx为当前登录用户名 2.替换table为实际Hive目标表名
dfhome=dfhome.drop("egame_id","eteam_id","enewteam_id","enewwin","eseason","newgame_id","elo","newelo","ecurwin")
dfhome.write.format("hive").mode("overwrite").saveAsTable("user_beta.table1109")
print('success')
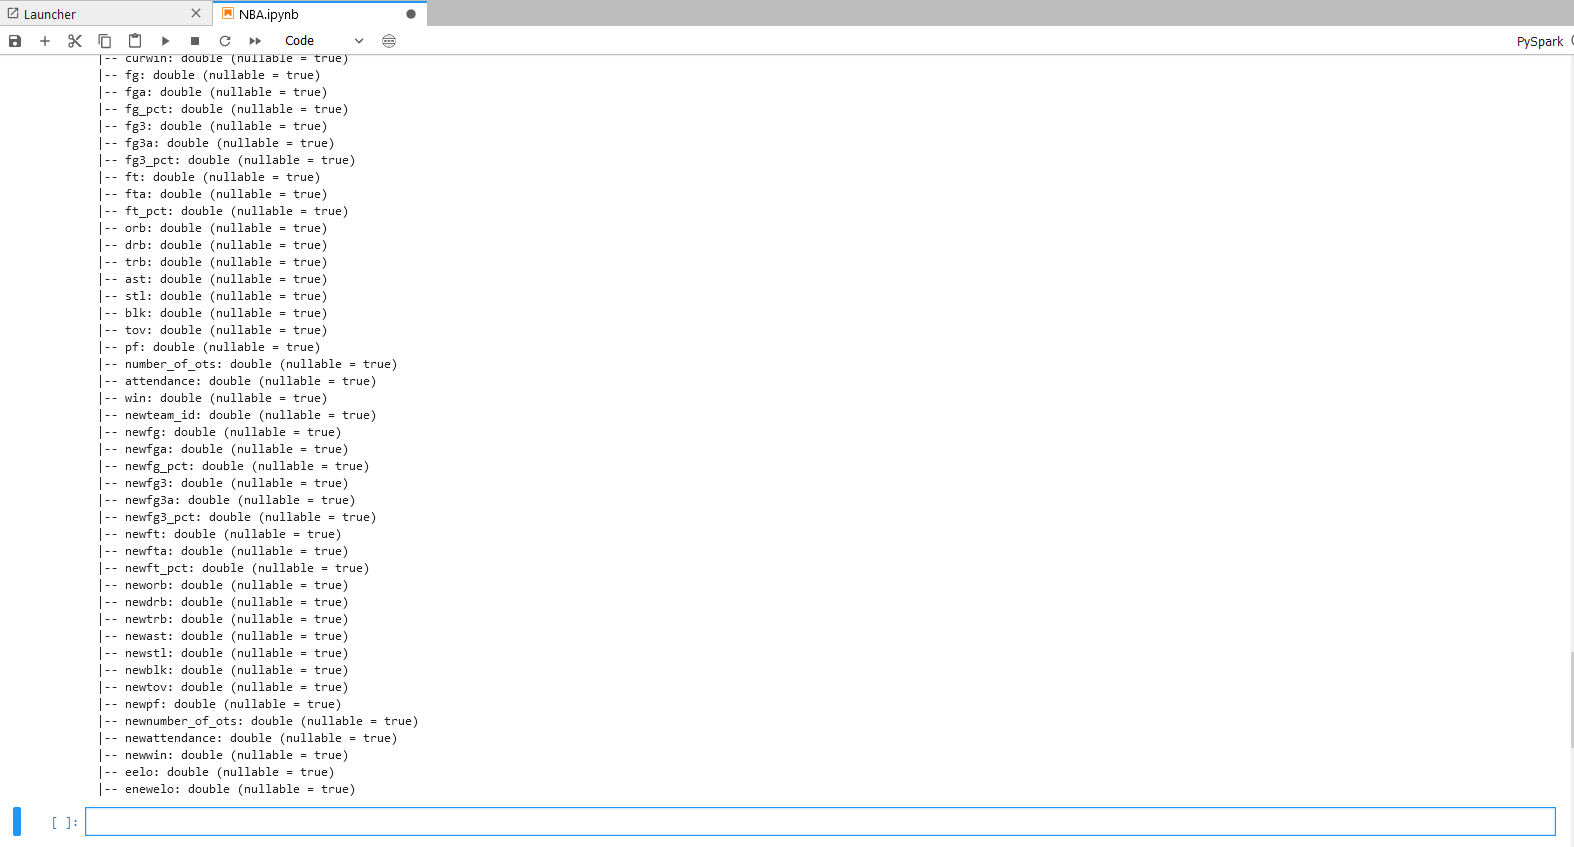
dfhome.printSchema()
步骤十说明 将结果数据导出到目标Hive库表
步骤五:分类模型
本步骤将用五种不同的classifer模型来对数据集进行初步训练,比较哪种模型在检测转账欺诈上更精准。
延续上一步的PySpark notebook继续操作。
步骤一操作
注:
机构项(xxx_xxx为org_xxx)1.替换org_xxx的xxx为机构名称 2.替换table1为实际Hive目标表名个人项(xxx_xxx为user_xxx)1.替换user_xxx的xxx为当前登录用户名 2.替换table1为实际Hive目标表名
from pyspark.ml.feature import VectorAssembler
df=spark.sql("select * from user_beta.table1109")
df_assembler1 = VectorAssembler(inputCols=['fg','fga','fg_pct','fg3','fg3a','fg3_pct','ft','fta','ft_pct','orb','drb','trb','ast','stl','blk','tov','pf','number_of_ots','attendance','win','newfg','newfga','newfg_pct','newfg3','newfg3a','newfg3_pct','newft','newfta','newft_pct','neworb','newdrb','newtrb','newast','newstl','newblk','newtov','newpf','newnumber_of_ots','newattendance','newwin','home','eelo','enewelo'],outputCol='features')
today= df_assembler1.transform(df)
today=today.select("game_id","curwin","features","year","season")
dftrain=today.filter(today['season']!="2019-20")
dftest=today.filter(today['season']== "2019-20")
train=dftrain.filter(today['season']!='2018-19')
test=dftrain.filter(today['season']=='2018-19')
print('success')
步骤一说明 - 数据转换与导入
导入上一个步骤的输出到Jupyter,并将给定的多列转换为一个向量列。 将2019赛季的数据设为测试集,剩下的数据设为训练集。
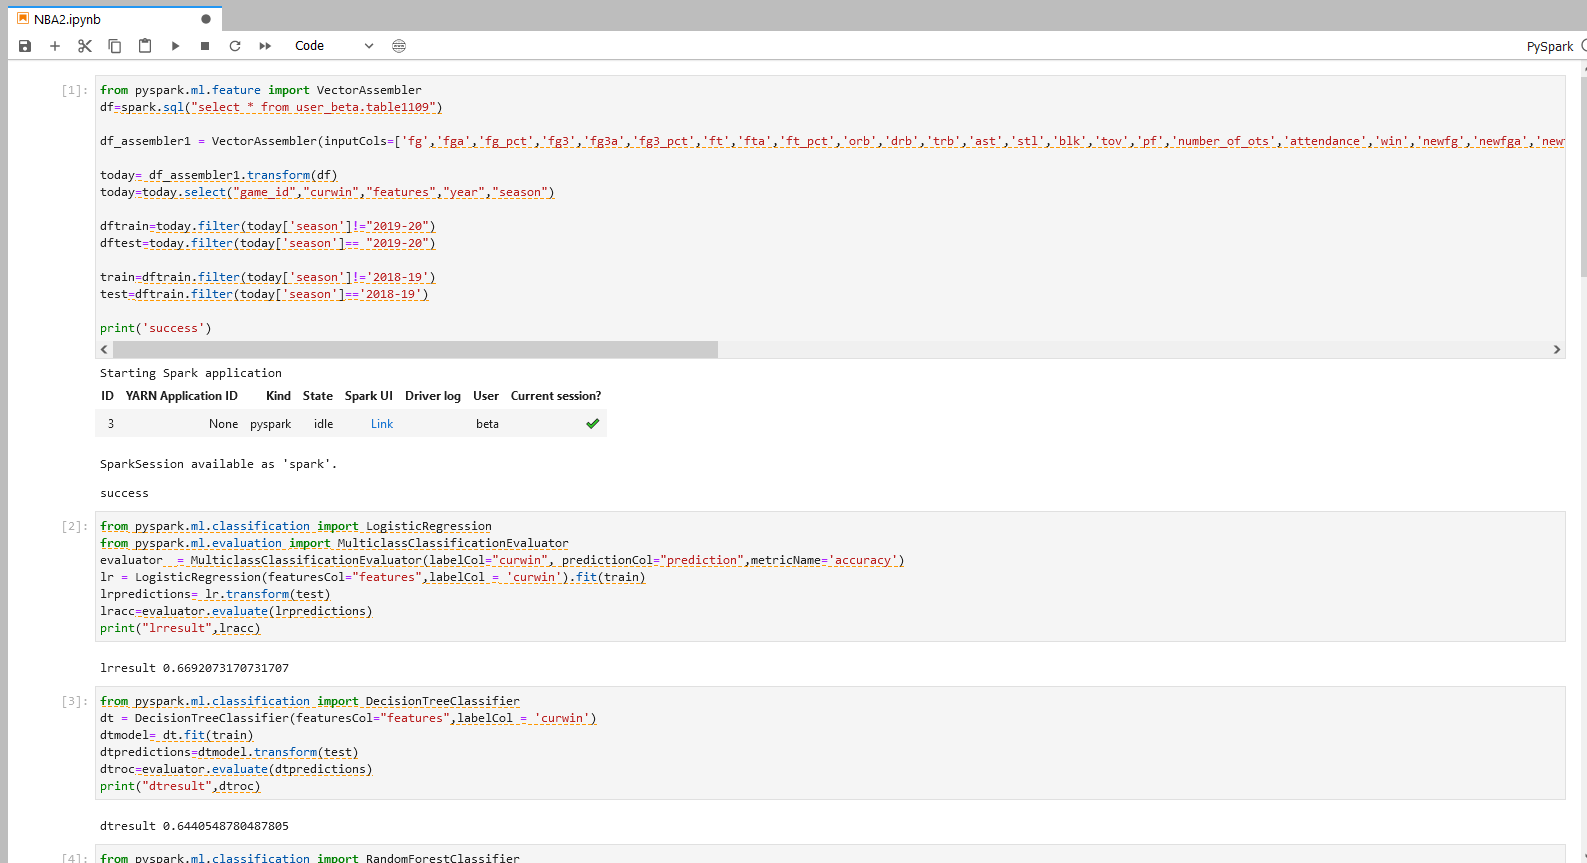
步骤二操作
逻辑回归
from pyspark.ml.classification import LogisticRegression
from pyspark.ml.evaluation import MulticlassClassificationEvaluator
evaluator  = MulticlassClassificationEvaluator(labelCol="curwin", predictionCol="prediction",metricName='accuracy')
lr = LogisticRegression(featuresCol="features",labelCol = 'curwin').fit(train)
lrpredictions= lr.transform(test)
lracc=evaluator.evaluate(lrpredictions)
print("lrresult",lracc)
决策树分类
from pyspark.ml.classification import DecisionTreeClassifier
dt = DecisionTreeClassifier(featuresCol="features",labelCol = 'curwin')
dtmodel= dt.fit(train)
dtpredictions=dtmodel.transform(test)
dtroc=evaluator.evaluate(dtpredictions)
print("dtresult",dtroc)
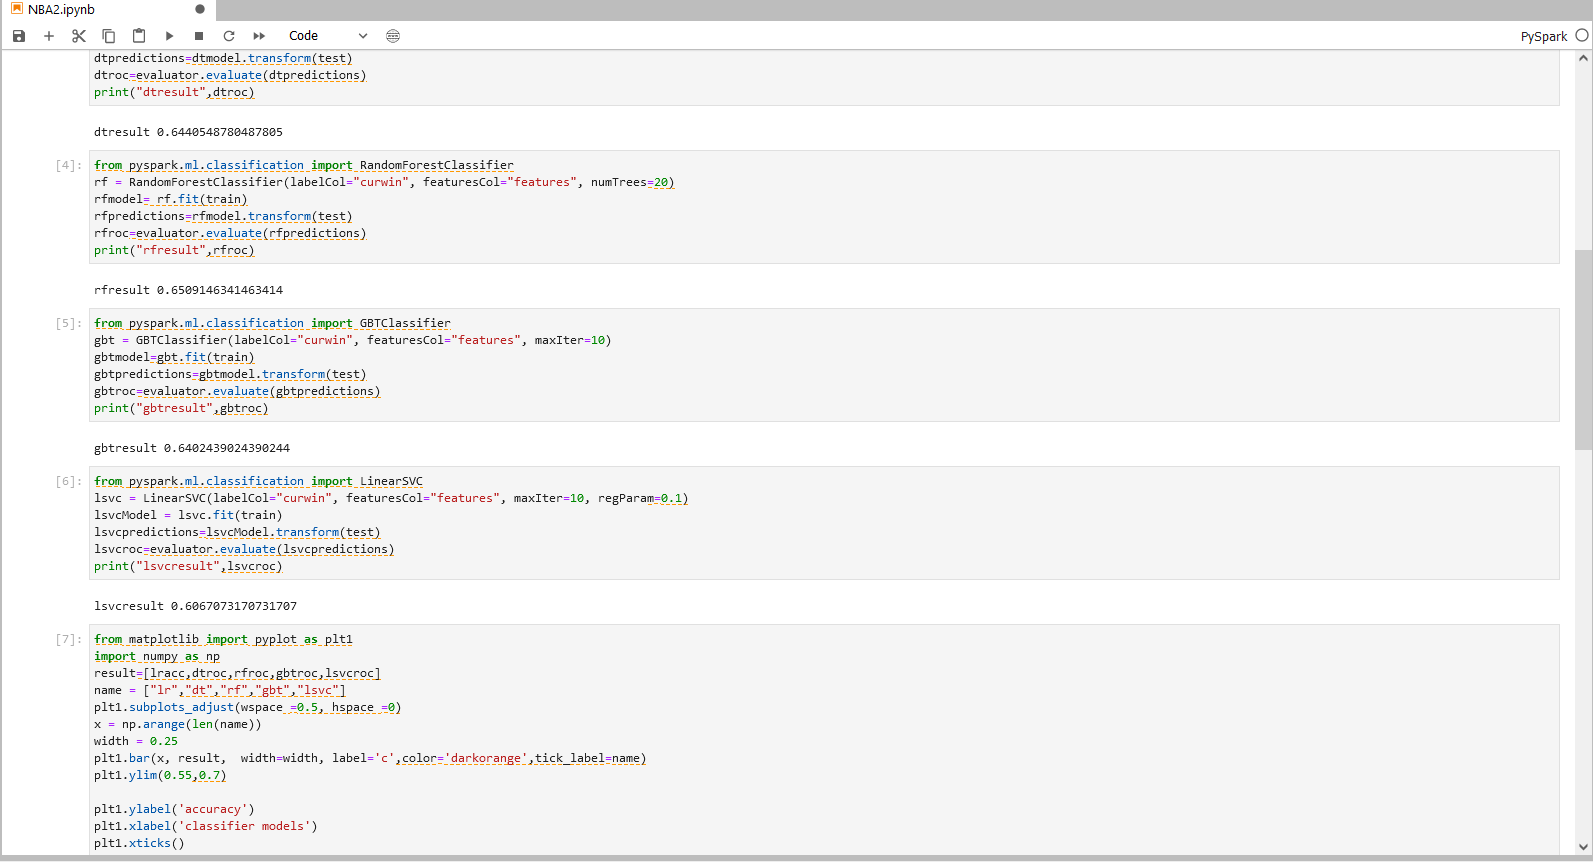
随机森林分类
from pyspark.ml.classification import RandomForestClassifier
rf = RandomForestClassifier(labelCol="curwin", featuresCol="features", numTrees=20)
rfmodel= rf.fit(train)
rfpredictions=rfmodel.transform(test)
rfroc=evaluator.evaluate(rfpredictions)
print("rfresult",rfroc)
梯度提升决策树分类
from pyspark.ml.classification import GBTClassifier
gbt = GBTClassifier(labelCol="curwin", featuresCol="features", maxIter=10)
gbtmodel=gbt.fit(train)
gbtpredictions=gbtmodel.transform(test)
gbtroc=evaluator.evaluate(gbtpredictions)
print("gbtresult",gbtroc)
线性支持向量分类
from pyspark.ml.classification import LinearSVC
lsvc = LinearSVC(labelCol="curwin", featuresCol="features", maxIter=10, regParam=0.1)
lsvcModel = lsvc.fit(train)
lsvcpredictions=lsvcModel.transform(test)
lsvcroc=evaluator.evaluate(lsvcpredictions)
print("lsvcresult",lsvcroc)
步骤二说明 - 分类模型
分别使用五类模型:逻辑回归,决策树分类,随机森林分类,梯度提升决策树分类,线性支持向量分类,对数据集进行拟合,完成预测,并将预测的评估结果打印。
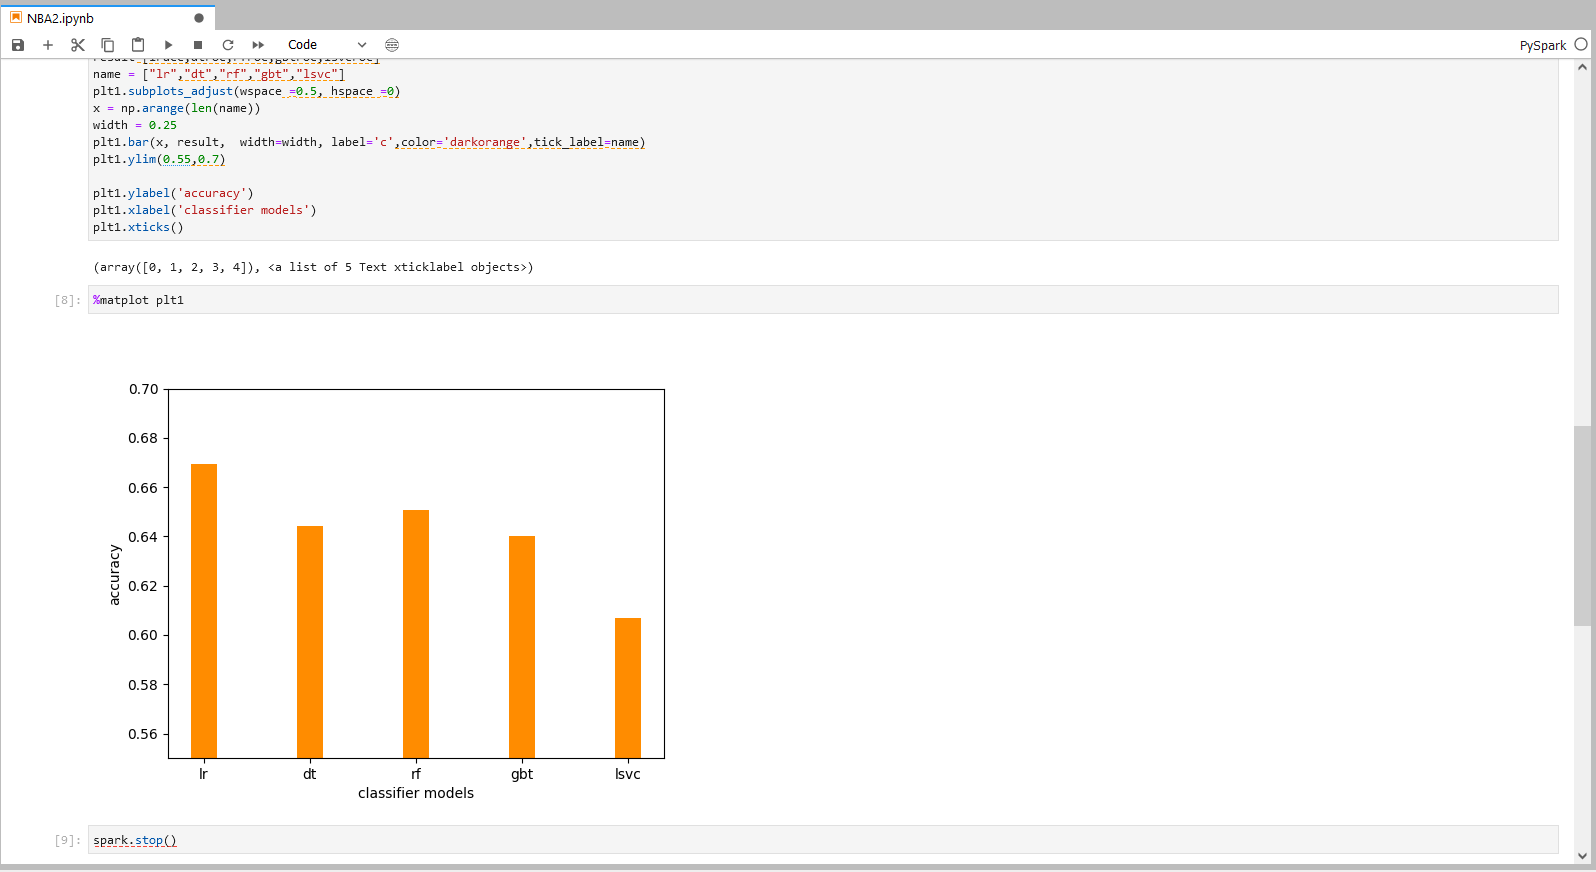
步骤三操作
from matplotlib import pyplot as plt1
import numpy as np
result=[lracc,dtroc,rfroc,gbtroc,lsvcroc]
name = ["lr","dt","rf","gbt","lsvc"]
plt1.subplots_adjust(wspace =0.5, hspace =0)
x = np.arange(len(name))
width = 0.25
plt1.bar(x, result,  width=width, label='c',color='darkorange',tick_label=name)
plt1.ylim(0.55,0.7)

plt1.ylabel('accuracy')
plt1.xlabel('classifier models')
plt1.xticks()
%matplot plt1
步骤三说明
将分类模型的准确率结果可视化 根据以上的准确度分析,选择表现较好的LogisticRegression模型,来进行后续的参数组合训练。
具体操作和结果可以参照下图。
步骤六:LR模型调参
使用LR模型和参数调优找到最佳参数组合,并导出预测结果。
延续上一步的PySpark notebook继续操作。
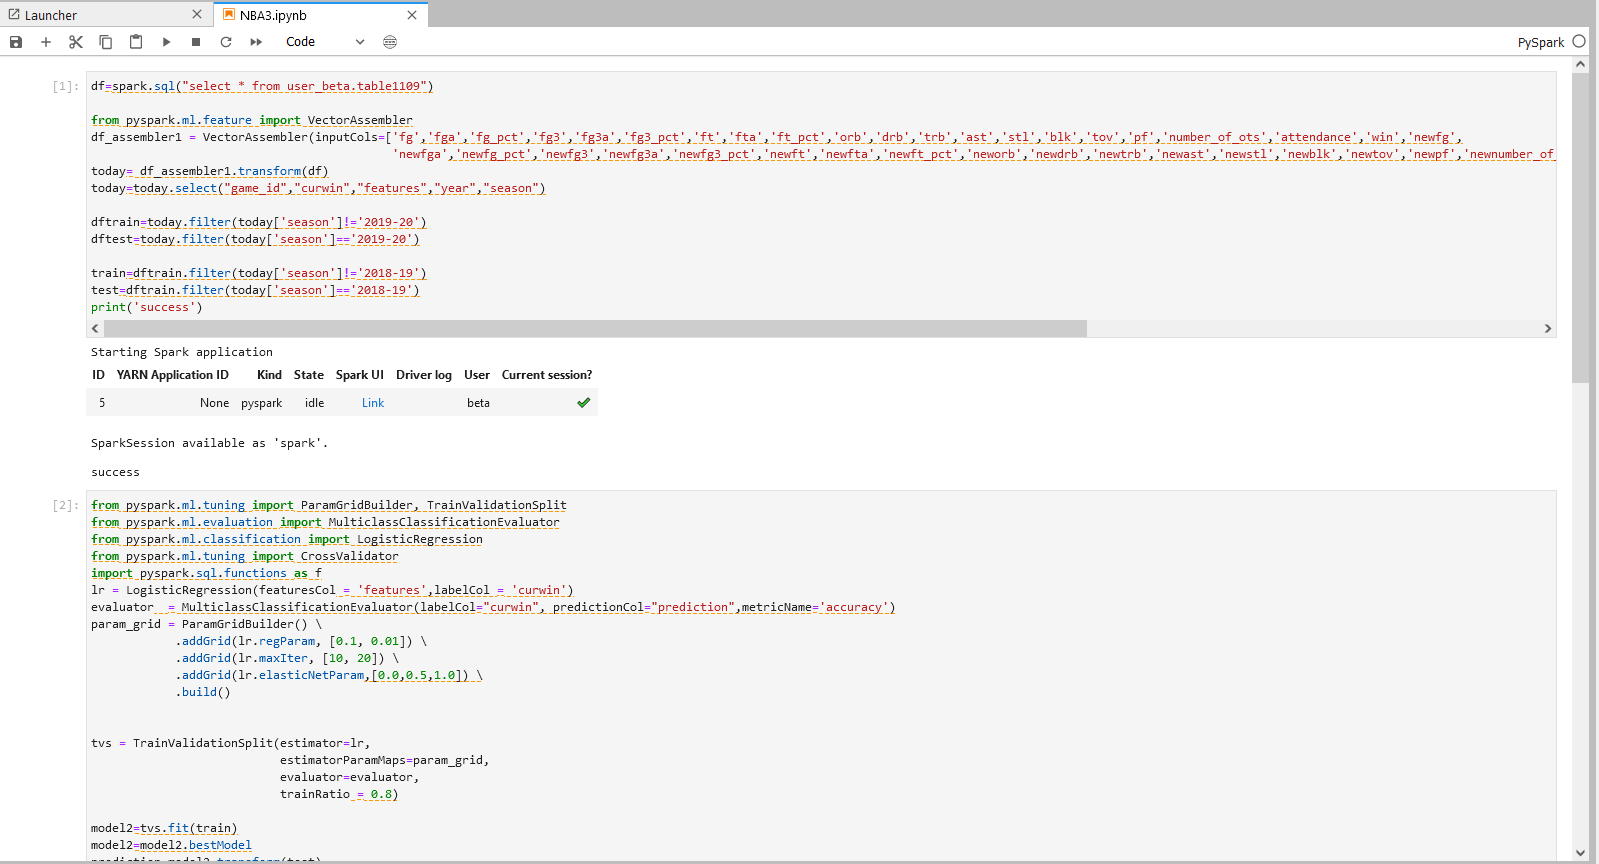
步骤一操作
注:
机构项(xxx_xxx为org_xxx)1.替换org_xxx的xxx为机构名称 2.替换table为实际Hive目标表名个人项(xxx_xxx为user_xxx)1.替换user_xxx的xxx为当前登录用户名 2.替换table为实际Hive目标表名
df=spark.sql("select * from user_beta.table1109")
from pyspark.ml.feature import VectorAssembler
df_assembler1 = VectorAssembler(inputCols=['fg','fga','fg_pct','fg3','fg3a','fg3_pct','ft','fta','ft_pct','orb','drb','trb','ast','stl','blk','tov','pf','number_of_ots','attendance','win','newfg',
'newfga','newfg_pct','newfg3','newfg3a','newfg3_pct','newft','newfta','newft_pct','neworb','newdrb','newtrb','newast','newstl','newblk','newtov','newpf','newnumber_of_ots','newattendance','newwin','home','eelo','enewelo'],outputCol='features')
today= df_assembler1.transform(df)
today=today.select("game_id","curwin","features","year","season")
dftrain=today.filter(today['season']!='2019-20')
dftest=today.filter(today['season']=='2019-20')
train=dftrain.filter(today['season']!='2018-19')
test=dftrain.filter(today['season']=='2018-19')
print('success')
步骤一说明 - 数据转换与导入 导入上一个步骤的输出到Jupyter,将给定的多列转换为一个向量列,并将数据分成测试集和训练集。
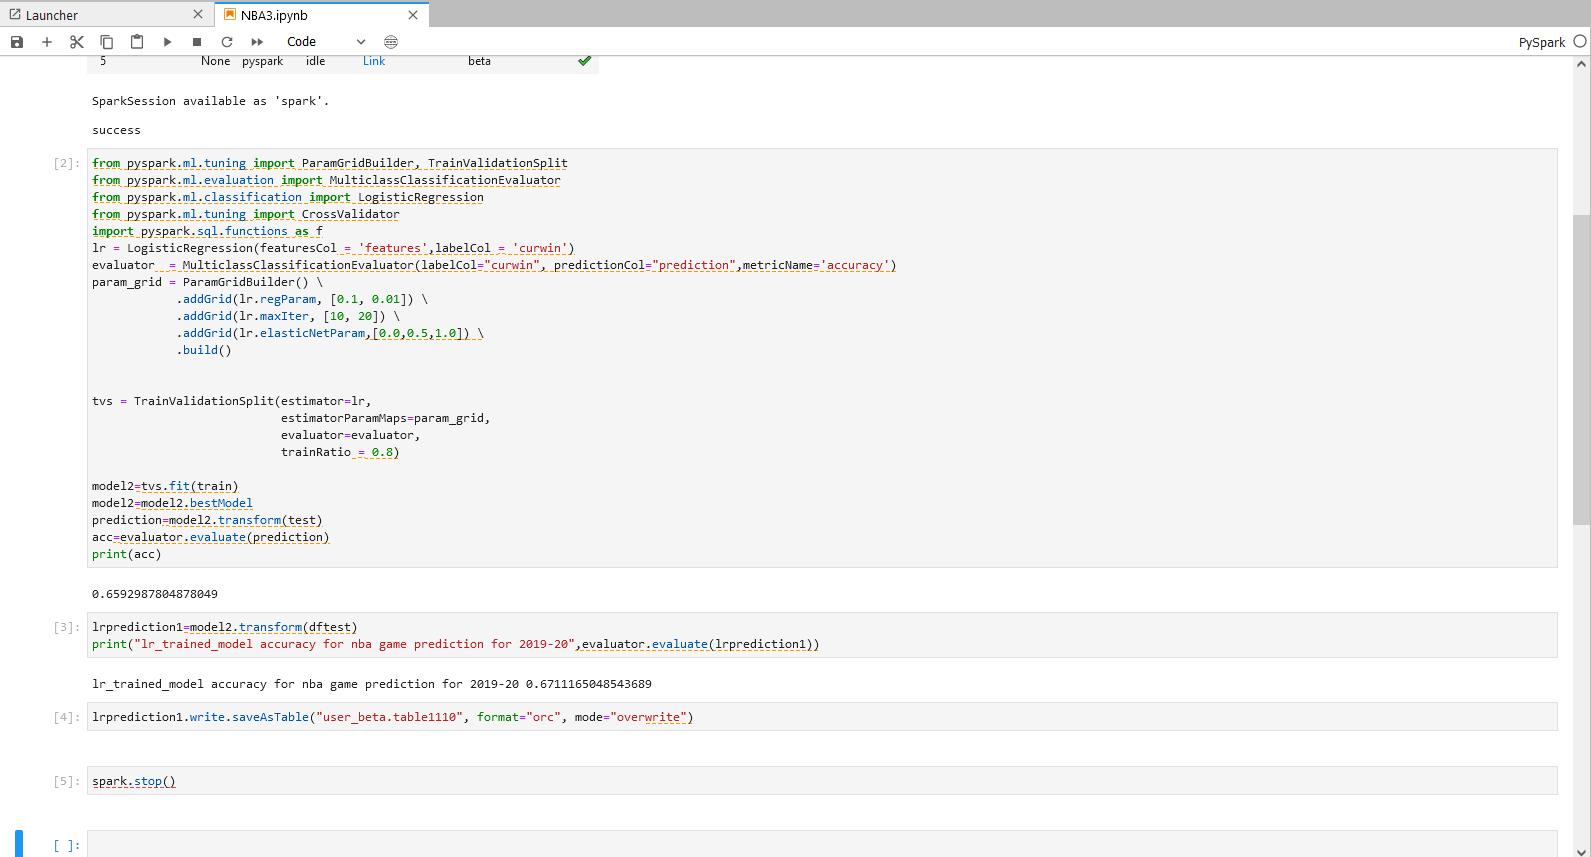
步骤二操作
from pyspark.ml.tuning import ParamGridBuilder, TrainValidationSplit
from pyspark.ml.evaluation import MulticlassClassificationEvaluator
from pyspark.ml.classification import LogisticRegression
from pyspark.ml.tuning import CrossValidator
import pyspark.sql.functions as f
lr = LogisticRegression(featuresCol = 'features',labelCol = 'curwin')
evaluator = MulticlassClassificationEvaluator(labelCol="curwin", predictionCol="prediction",metricName='accuracy')
param_grid = ParamGridBuilder() \
.addGrid(lr.regParam, [0.1, 0.01]) \
.addGrid(lr.maxIter, [10, 20]) \
.addGrid(lr.elasticNetParam,[0.0,0.5,1.0]) \
.build()
tvs = TrainValidationSplit(estimator=lr,
estimatorParamMaps=param_grid,
evaluator=evaluator,
trainRatio = 0.8)
model2=tvs.fit(train)
model2=model2.bestModel
prediction=model2.transform(test)
acc=evaluator.evaluate(prediction)
print(acc)
步骤二说明 - LR模型的调参与预测
运用TrainValidationSplit(TVS)来进行参数调优。运用param_grid方程来定义TVS检测的参数,对12种参数组合模型进行测试。
使用最优检测模型对数据进行拟合并输出最佳预测结果。
步骤三操作
lrprediction1=model2.transform(dftest)
print("lr_trained_model accuracy for nba game prediction for 2019-20",evaluator.evaluate(lrprediction1))
步骤三说明
根据打印结果,可以得到,经过参数调优后的模型对于19-20赛季有67.1%的正确率
步骤四操作
注:机构项目时: “xxx_xxx.table2″为org_xxx,xxx替换为当前机构名,table2替换为用户自定义的Hive表名。
个人项目时: “xxx_xxx.table2″为user_xxx,xxx替换为当前登录用户名,table2替换为用户自定义的Hive表名。
lrprediction1.write.saveAsTable("user_beta.table1110", format="orc", mode="overwrite")
spark.stop()
步骤四说明 - 结果数据存储
将最佳预测结果存入hive表中。
具体操作和结果可参照下图。
备注:建议完成整个步骤后将该项工程暂停,可参考下图。

欢迎访问网站,注册体验BDOS Online,网站地址:https://bo.linktimecloud.com/

留言
评论
暂时还没有一条评论.